
Norway - Salt Body Definition
An example from our Marine-FTG® survey.
Salt bodies have long been associated with oil and gas discoveries due to the post-depositional mobilization that generates complex structures and steeply dipping beds that are ideal for migration and trapping of hydrocarbons.
Seismic imaging methods depend on iterative velocity “floods” to pair previously picked top salt with a base that may or may not become a coherent reflector. The inability to pick a confident base of salt via standard seismic depth migration has led to many failed wells, false prospects and dry holes throughout the history of hydrocarbon exploration. However, the integrated interpretation of seismic data along with gravity and gravity gradiometry can be used to reduce geometry uncertainty.
Equinor published results from a Bell Geospace Marine-FTG® survey in 2014 (C. Stadtler et al., 2014) that underlines the importance of integrating FTG into their depth imaging workflows after two wells drilled on the Uranus Salt Dome of the Nordknapp Basin failed to reach a falsely imaged objective.
3D Inversion results integrating Marine-FTG ® produce a superior image of the salt geometry. A seismic cross-section shown in Figure 2 shows the Uranus salt dome with the preliminary interpretation (pink) along with inversion results from MT, CSEM and FTG.
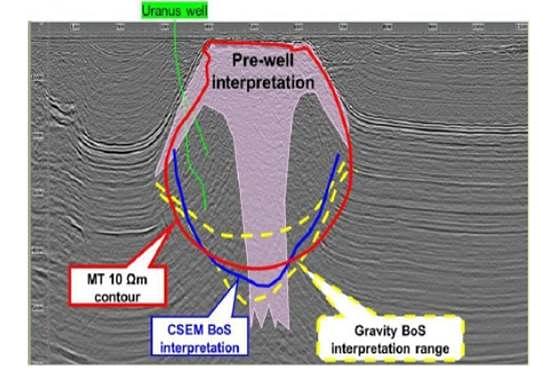
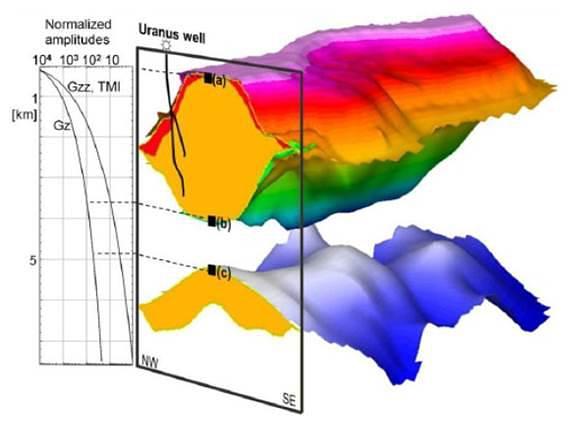
Figure 3 shows a cross-section of the final 3D model salt adjacent to a chart depicting the normalized amplitudes and associated decay with depth. The author concluded that Tzz anomalies were useful for inversion for the salt canopy while the Tz was required for resolving the mother salt.
Intuitive use of marine gravity along with Marine-FTG® data with seismic data facilitates direct 3D mapping of not only the salt dome structures but it also delineates the underlying mother salt. Subsalt structures which either hold or control the migration of hydrocarbons are defined by the geometry of the mother salt. Therefore, understanding its geometry is of key importance.