FTG in the Exploration & Production Workflow
FTG paves a clear path for decision making. Clear, high resolution, highly accurate gravity maps from FTG establishes its value proposition when depicting subsurface complexity. FTG steers successful outcomes when de-risking projects.
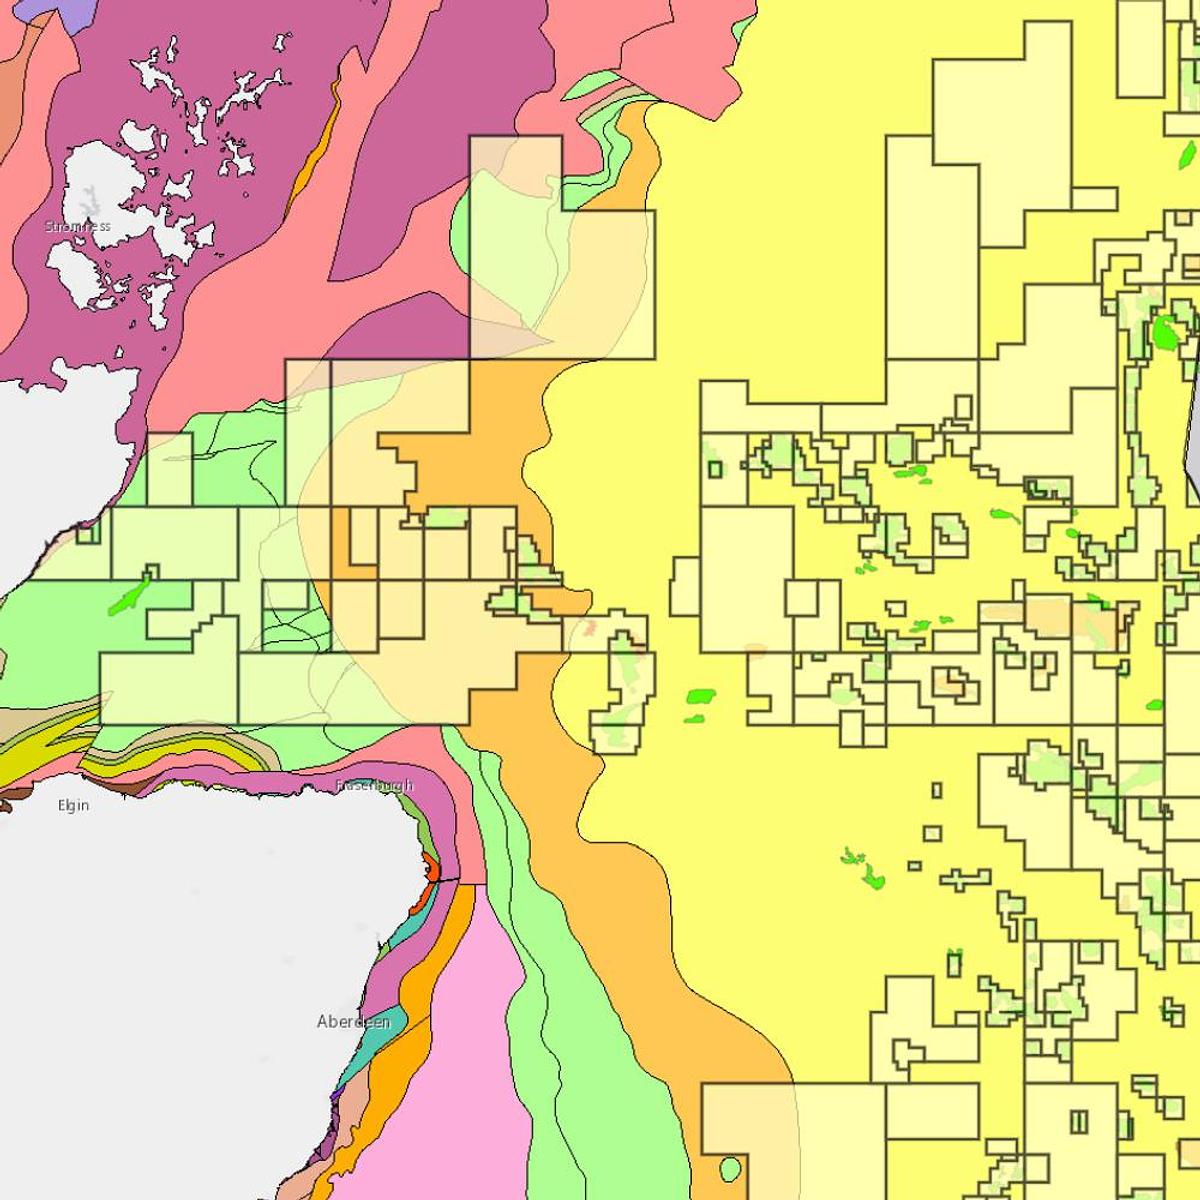


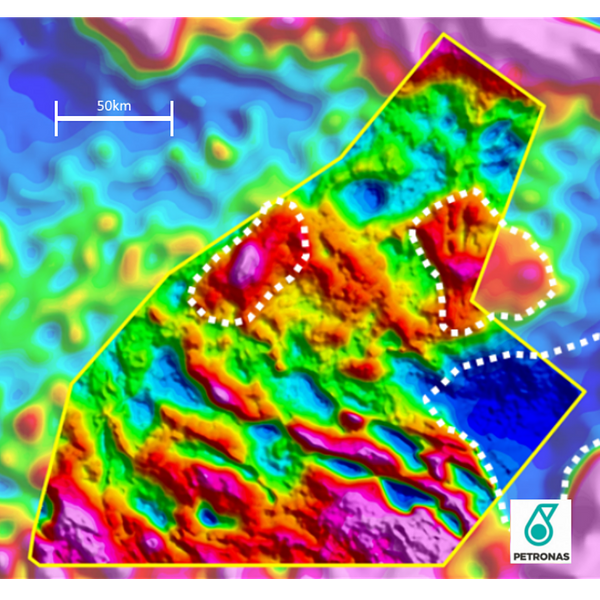
Frontier exploration benefits from having FTG data on board by reducing risk when fast-tracking exploration initiatives. Largescale holdings often only have low-resolution data (like that shown on the left) to use when making key decisions for exploration work programmes. The gravity data coverage, in this case, depicts a large sedimentary basin area that is bordered by shallow basement to the south, east and north. Shallowing basement is indicated in central areas and a number of prospective structures are highlighted. The addition of FTG data improves the imaging of these structures and points to the presence of additional prospective structures. The data was acquired on a regional scaled survey with 2km line spacings.
The value proposition presented by the FTG is clear – definitive imaging of prospective structural trends over a large area. Having FTG data on board accelerates decision making exercises by accurately mapping prospectivity in a frontier setting. The benefit to the industry is immense. Governments can confidently set exploration licensing rounds using these maps and exploration companies can efficiently screen large holdings when planning work programmes.
The key strength of FTG is its ability to detect and delineate primary structural controls on prospectivity in a basin setting. Locating structures are fundamental to successful exploration and the precedent to this success is seismic imaging. However, poorly located and/or poor quality seismic is often costly in terms of time and budgets when working exploration projects. FTG solves this problem.
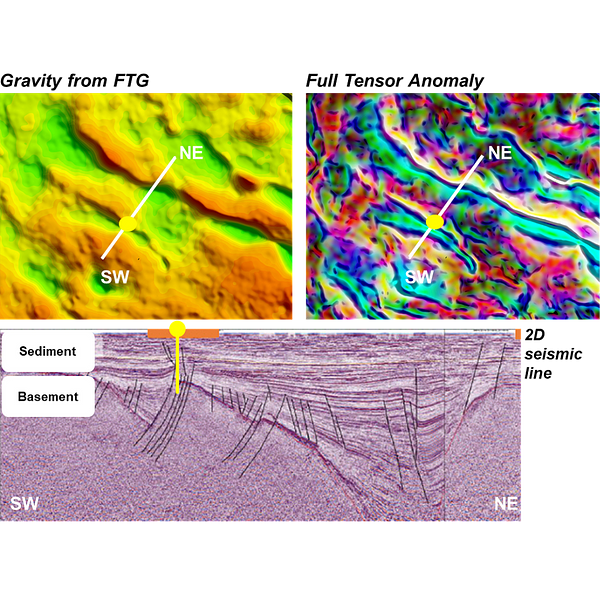
In the images to the left, the located seismic line and well track the southeast edge of a clear FTG Gravity anomaly. The warm colours point to shallowing basement to the southwest and northeast, but also locates a standalone fault block in the centre. The 2D seismic line adds definition to the FTG Gravity anomaly lending confidence when interpreting the gravity anomaly as directly sourced by the drilled fault block. The gravity anomaly indicates the structure extends to the northwest before pinching out. The Full Tensor Anomaly map, generated from the directly measured tensor components, facilitates detailed mapping of the block’s structural complexity and indicates a gentle dip to the northeast into a more complex basin shape.
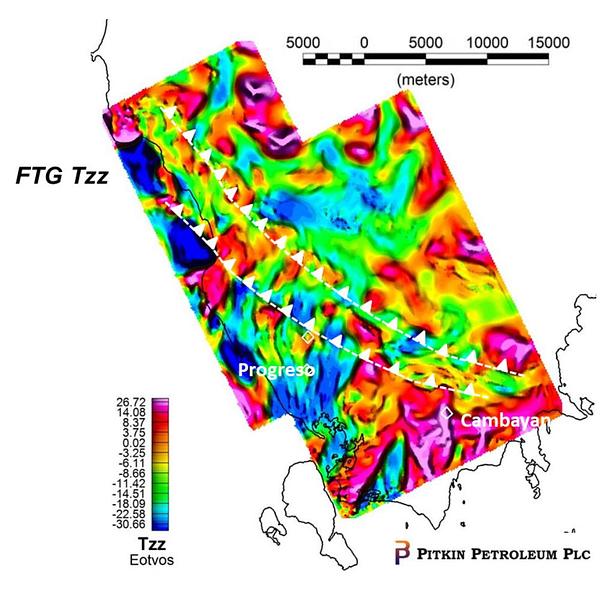
Pitkin Petroleum commissioned FTG surveying in the Philippines to identify and map sub-surface structural complexity in a Fold and Thrust Belt setting. The FTG Tzz anomaly pattern locates a series of positive anomalies associated with folded sequences. Linear fault trends are directly mapped using the additional tensor component data and successfully map the targeted north-northeast strike slip fault trend that plays host to the known Progreso structure.

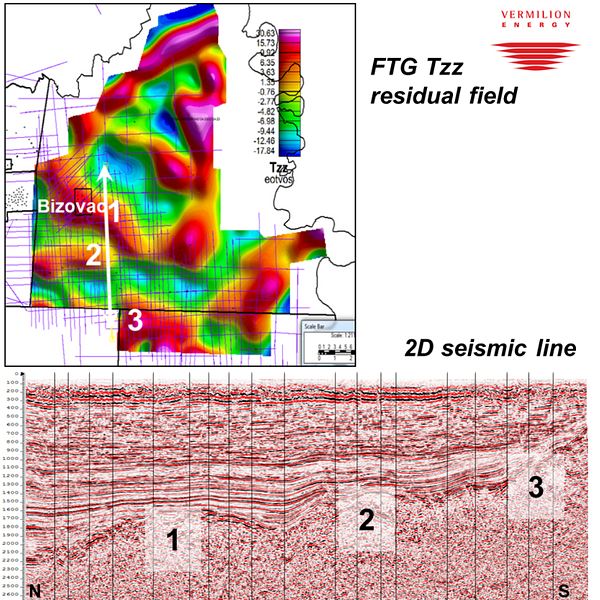
FTG data were acquired on the margins of the Pannonian Basin in northeast Croatia in 2017 for Vermilion Energy to steer planning of a seismic acquisition programme. The anomalous patterns are confirmed by existing seismic data and indicate the structure hosting the Bizovac field is larger than previously considered. The FTG data identifies additional prospectivity to the northeast where a new seismic programme is being considered.

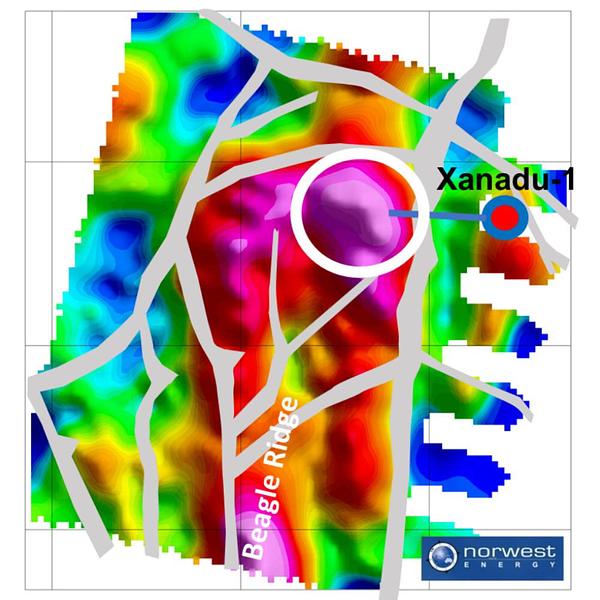
An Air-FTG® survey was acquired for Norwest Energy in the North Perth Basin to assist with interpretation of seismic data acquired in a near shore setting ahead of a well planning exercise. The positive gravity anomaly confirms the seismic interpretation (grey fault pattern) identifying the Xanadu prospect. The well was drilled in 2017 and encountered hydrocarbons. This is an excellent example of an integrated FTG – seismic workflow and demonstrates the clear advantage of acquiring FTG data over nearshore/transition zone settings where seismic acquisition can be cost prohibitive.
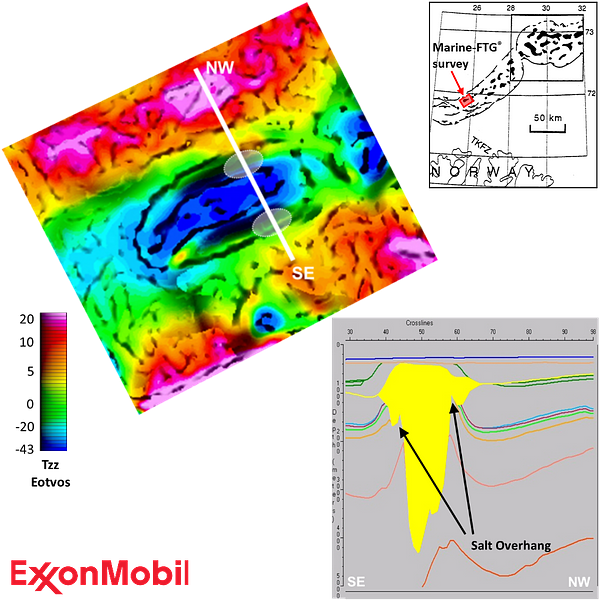
FTG data acquired in the Nordkapp Basin for ExxonMobil back in 1999 identifies and delineates salt body complexity. The Tzz image clearly maps the low density salt body with a negative response (cold colours). 3D analysis of the full tensor components maps two edges of salt, an inner wall and an outer wall. These are clearly expressed by the grey linear patterns. In addition, the shaded zone maps a localised positive anomaly between the inner and outer rim that is interpreted as localised higher density sediment trapped beneath an overall salt overhang geometry on the body.

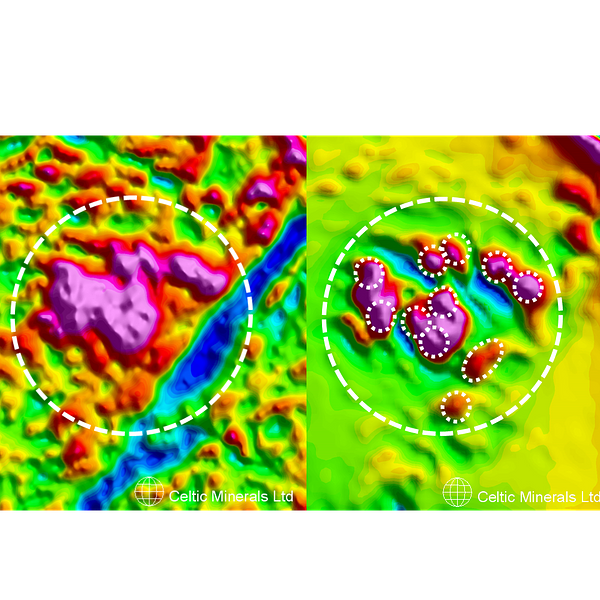
3D analysis of Tensor component data facilitates direct mapping of ‘drill-ready’ targets on mineral exploration programmes. FTG data acquired for Celtic Minerals over the Budgells Harbour area in Eastern Canada show prime application. The left image displays the Tzz response of a large ultramafic intrusive body hosting mineralisation and the righthand image shows isolation of the anomaly pattern. These locate individual intrusives that collectively generate the large positive Tzz anomaly. The isolated responses are clear drill targets.
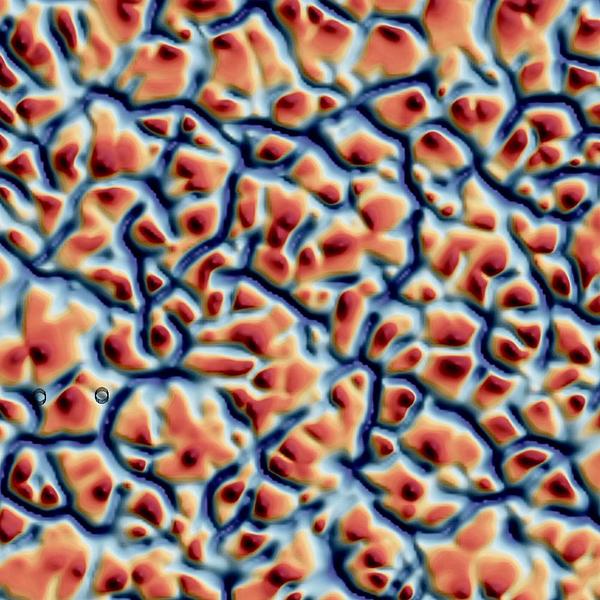
FTG is particularly suited for near surface geo-hazard detection due to the ultra high sensitivity to shallow density contrasts. Surveys acquired with tight line spacings optimise signal retrieval arising from complex bedrock/sub-surface geometries. The example shown is from the Permian Basin where FTG data are being acquired to directly locate and map the presence of sub-surface caverns and voids in order to de-risk costly seismic imaging and drilling programmes. Caverns are detected as negative anomalous linear anomalies and depicted in shades of grey on the map. Voids or areas of low density are represented by blue and correspond to high risk areas for drilling. Low risk areas for siting well platforms are areas of undisturbed bedrock or higher density and represented by red anomalous responses.