Geological Imaging from FTG data
Ternary imaging—a new development in FTG interpretation for the 2020s.
Full tensor imaging facilitates direct geological mapping from FTG data and resolves structural complexity that is often not understood when just working with gravity data alone.
The added information retrieved from the tensor data directly facilitates exploration decision making when working prospective ground.
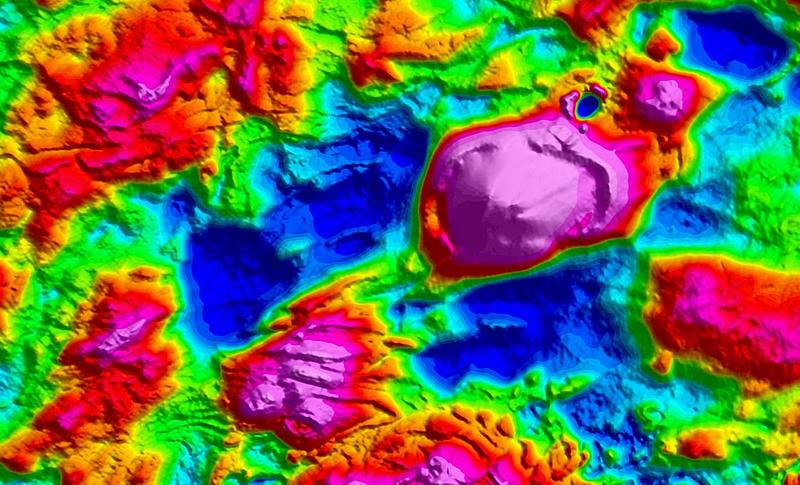
Full Tensor Anomaly
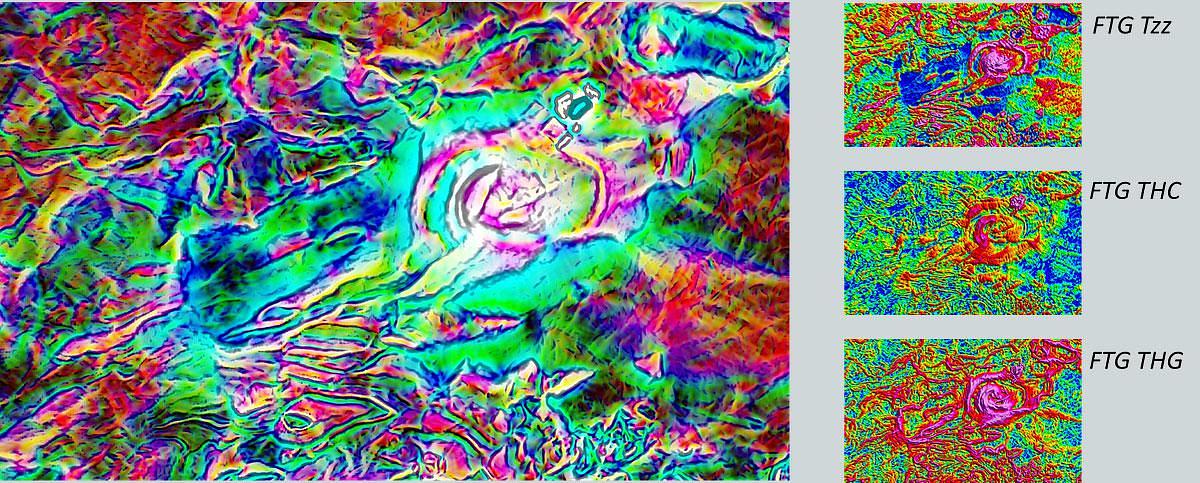
The three elements Tzz, total horizontal curvature (THC) and total horizontal gradient (THG) are well suited for colour blended imagery. RGB imaging methods are employed to display the tensor as a single image.
RGB—or Red Green Blue—imaging allows the intermixing of these three primary colours to produce pattern maps. Shades of colours range from bright white to various hues of the primary colours depending on the combined anomaly magnitude.
For example, an equal mix of red, green and blue will produce a composite colour that is white, whereas a disproportionate mix of blue and green will produce colours from cyan to yellow.
For FTG, we colourise the three primary elements of the tensor with Tzz set in shades of red, the THC in shades of green and the THG in shades of blue. The resultant tensor image displays a range of colours where the tensor information depicts geology.
For example, low density rocks generating a negative response for Tzz but with high curvature and variable gradient (e.g. s-type granites or sedimentary basins) will yield green to cyan colours.
On the other hand, fault blocks or igneous intrusives with their higher density yielding positive Tzz, curvature and gradient responses will show yellow to white colours. Contact lineaments are best captured as zones of high gradient and will display as blue to magenta colours.
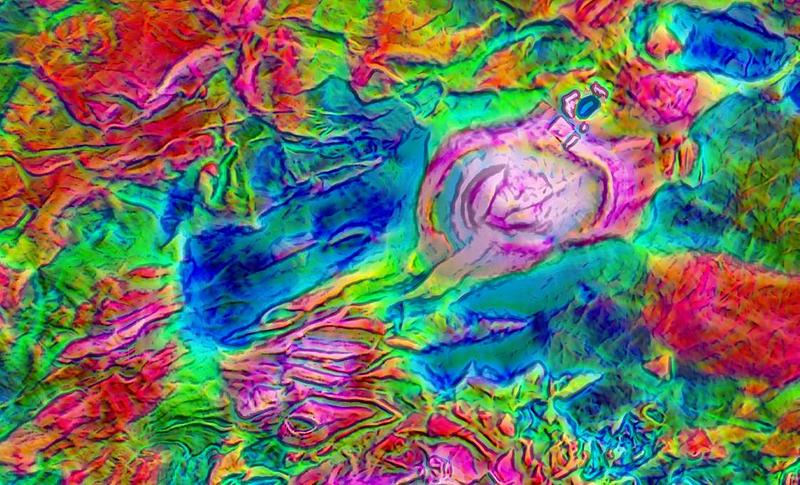
The image above shows the impact of RGB ternary imaging for geological interpretation from full tensor anomaly data.
High density zones forming structural shapes are easily identified with their white to yellow colours. Others include green/cyan colours forming a large rounded structure that appears cored by high density zones. Contact lineaments are depicted by narrow blue colours, whereas fault zones show as magenta to blue.
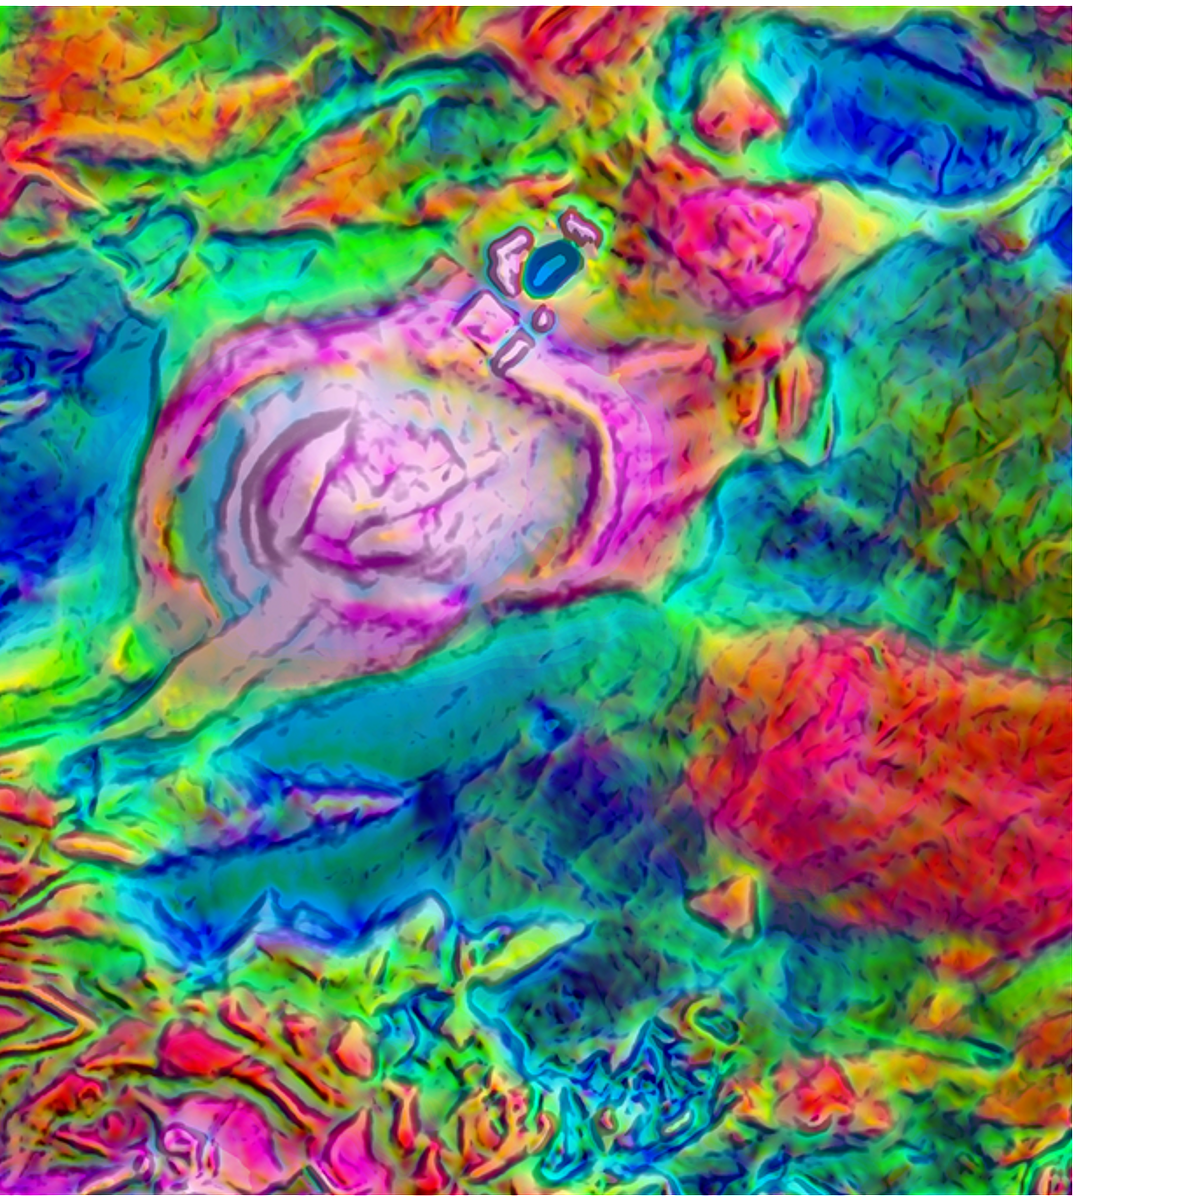
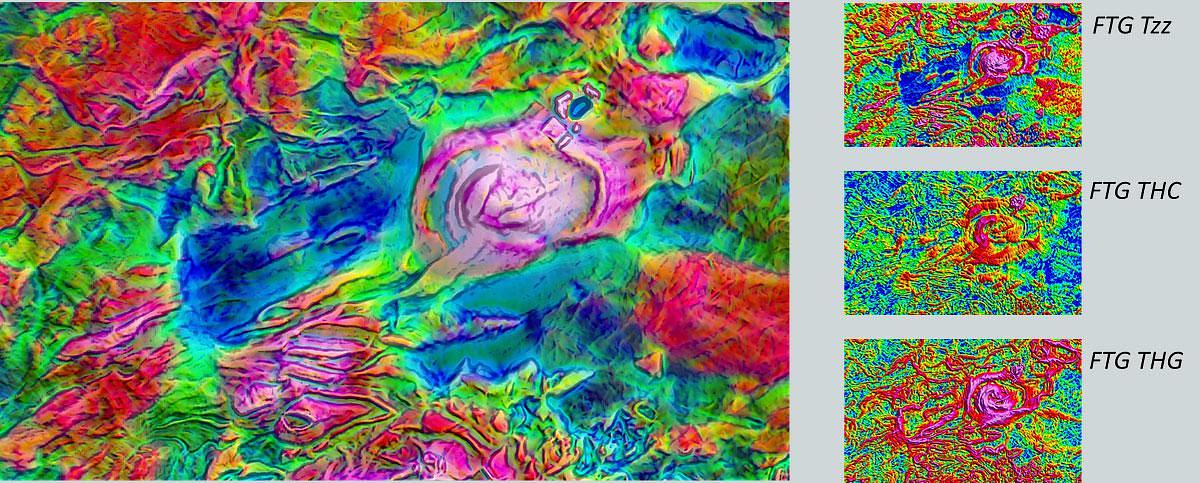
These blue lineaments are enhanced by including contact lineaments typically identified with FTG as a grey shaded grid element. The image above shows the impact for including the directly mapped contact lineaments. Their effect adds texture to the data to assist with fault mapping.
Gravity from the Tensor
Conventional gravity retrieved from tensor data offers significant uplift in resolution.
Signal bandwidth contains a high frequency signal content with resolution equal to that of the FTG data (from wavelengths equal to half spacing to wavelengths equal to the length of the shortest survey block dimension).
The impact is immense as this reliably retrieves the gravity effect of density contrasts, generating tensor anomalies sourced in the shallow to intermediate depth range on underway surveys.
The gravity field generated is inherently more stable than a mere vertical integration of the vertical tensor component, Tzz, as it includes the contribution from all components in its generation.
The image above testifies to FTG’s ability to produce a stable, conventional gravity field. Clear, narrow, lineated trends are easily visible amongst the longer wavelength patterns more typically associated with conventional gravity.
The Full Tensor
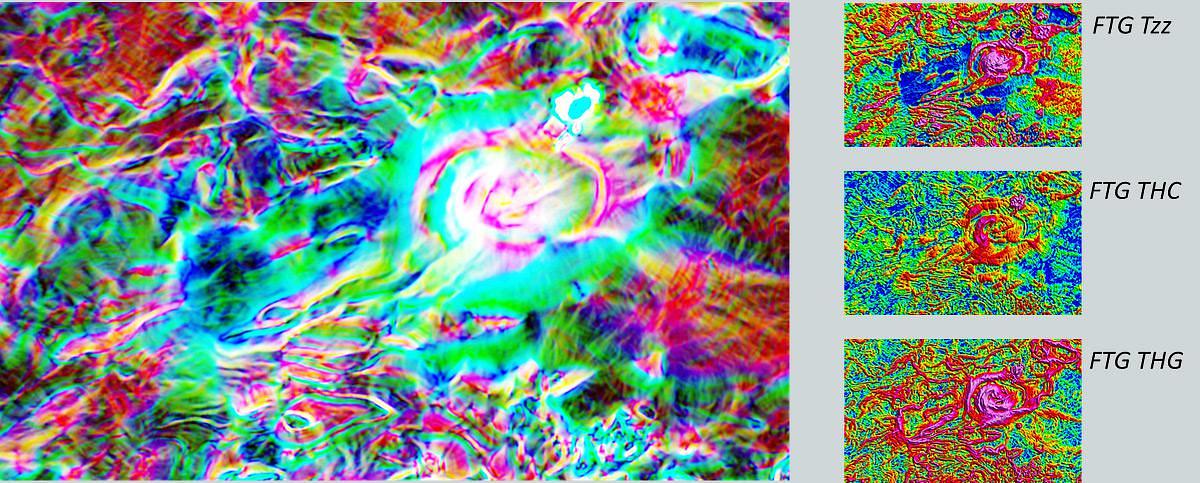
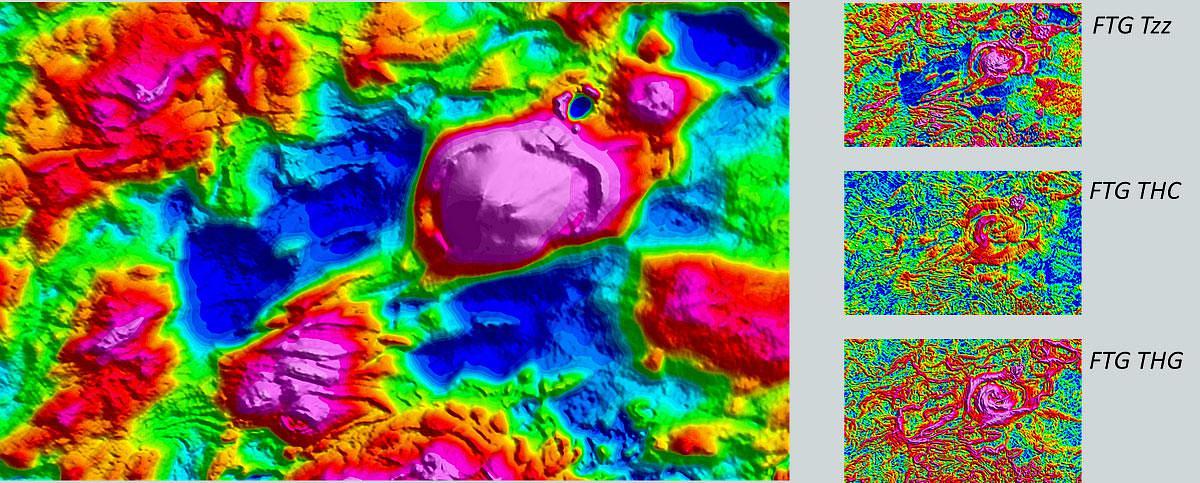
Tensor data are displayed with gravity data to assist with interpretation. However, displaying a semi-transparent overlay of the gravity data on the full tensor anomaly map provides a 3D perspective to better visualise source-depth concepts. The image below is one such display.
The gravity anomaly field retrieved from the FTG data is overlain with semi-transparency to resemble a draped overlay on the full tensor anomaly map.
The warm colours (reds) from the gravity identify high density rocks associated with elevated structures/intrusives. The cold colours (blues) identify lower density rocks associated with sediment filled basins and/or s-type granitic intrusions.
The tensor anomaly field depicts their structural complexity providing perspective in terms of both depth and content.
The overlay below shows the value of working with FTG data because tensor data resolves structural complexity that is often not understood when just working with gravity data alone.